
Decline In Species Populations Living Planet Index
Chart showing the Living Planet Index, showing decline in species population Version 4 (world and regional; data through 2020): Ritchie, Hannah. How does the Living Planet Index vary by region?. Our World in Data (OWID) (October 2025). Archived from the original on 5 March 2026. Deprecated archive.today presents actual chart better than archive.org: https://archive.vn/fCCNS Source states: The Living Planet Index (LPI) measures the average relative decline in monitored wildlife populations. The index value measures the change in abundance in 34,836 populations across 5,495 native species relative to the year 1970 (i.e. 1970 = 100%). Versions 2, 3 (world and regional): Data source for Version 2: How does the Living Planet Index vary by region?. Our World in Data (13 October 2022). Archived f...

Related Vectors
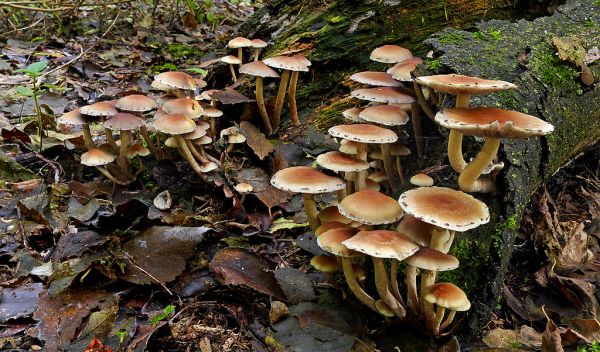
Sulphur tufts (Hypholoma fasciculare)
by
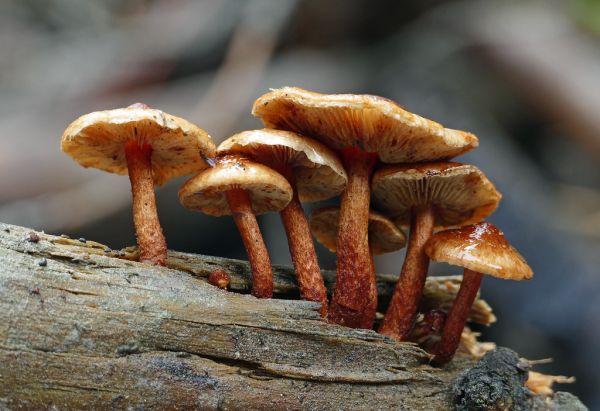
Sulphur tufts (Hypholoma fasciculare)
by

Portugal Sun goes Down
by

Blason Famille Be Goblet D'Alviella (Tournai)
by

Ṝỏⱥŗ ȍᵮ ṝṳꞩħįǹᶃ ⱳãƫɇѓᵴ
by

slighteth
by

Dry Grass
by

Blason Neuville Vitasse
by

Wyoming In United States
by

Type Pièce Lambel
by

Blason Buggenhout
by

Vernon Of Shotwick Park Arms
by

Havelock North CoA
by

Icône Ile
by

Ministry Of Skill Development And Entrepreneurship
by

Attributed Fictional Arms Of Isaac Komnenos
by

Ministry Of Coal India
by

Ministry Of Commerce And Industry
by

Ministry Of Agriculture India
by

Datagovin
by

Double Dual Nature
by

VFPt Horseshoe Magnet
by

Sarzana Stemma
by

Provincia Del Verbano Cusio Ossola Stemma
by

Roundel Of The Royal Malaysian Air Force Variant 02
by
Office Of The Secretary Of Defense Identification Badge
by

San Bartolomeo Al Mare Stemma
by

Degree Radian Conversion
by

达悟族旗帜
by

Cup O Coffee Simple
by

Connexon And Connexin Structure
by

Toxoplasmosis Life Cycle En
by

Basidium Schematic
by

Bata
by

Binomio Al Cubo
by

Foto Wiki Characteristic Curve
by
Comments (0)
Login to comment