
20211109 Frequency Of Extreme Weather For Different Degrees Of Global Warming Bar Chart IPCC AR6 WG1 SPM
Bar chart showing frequency of extreme weather for different degrees of global warming, based on data from IPCC AR6 WG1 SPM (Summary for Policy Makers). This SVG file contains embedded text that can be translated into your language, using any capable SVG editor, text editor or the SVG Translate tool. For more information see: About translating SVG files. Suggested caption: : The IPCC Sixth Assessment Report (2021) projected multiplicative increases in the frequency of extreme events compared to the pre-industrial era for heat waves, droughts and heavy precipitation events, for various global warming scenarios. Based on data from Fig. SPM.6 of: Climate Change 2021 / The Physical Science Basis / Working Group I contribution to the WGI Sixth Assessment Report of the Intergovernmental Pan...

Related Vectors
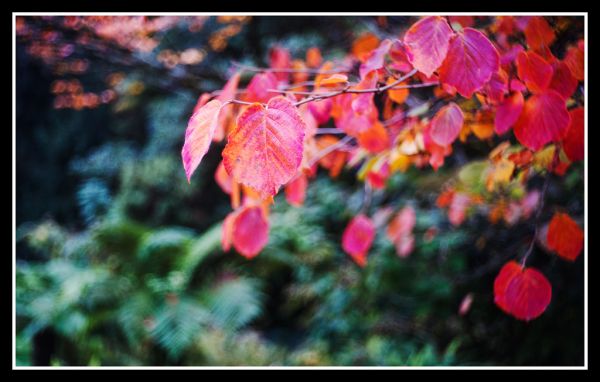
Ancient plants
by
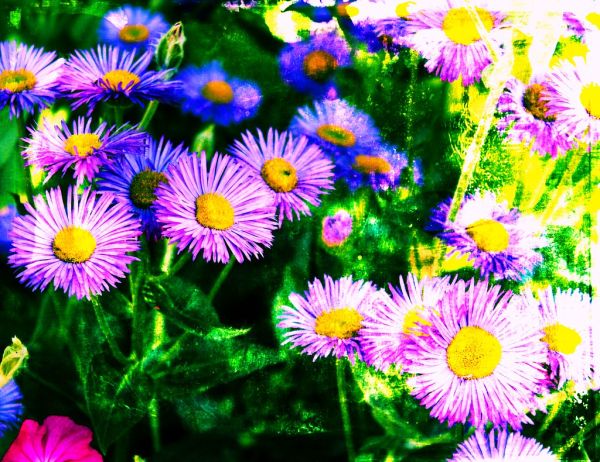
Joy comes in the morning
by
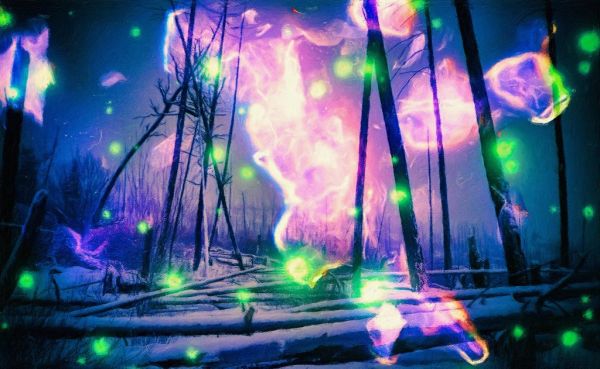
Groovy Nuclear Winter Wonderland
by
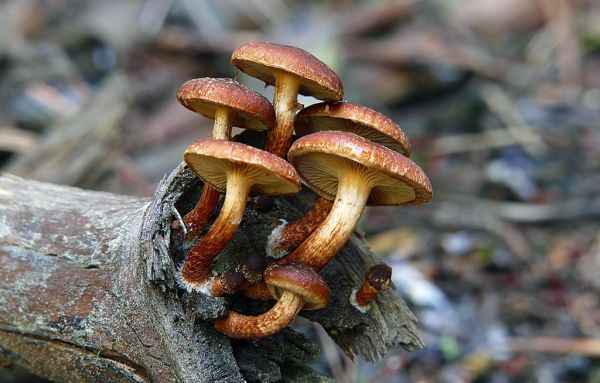
Sulphur tuft. (Hypholoma fasciculare)
by
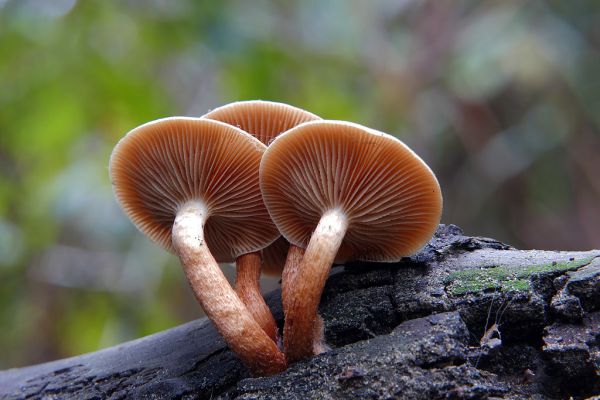
Sulphur tufts (Hypholoma fasciculare)
by

Collie dog drawing, hand drawn
by
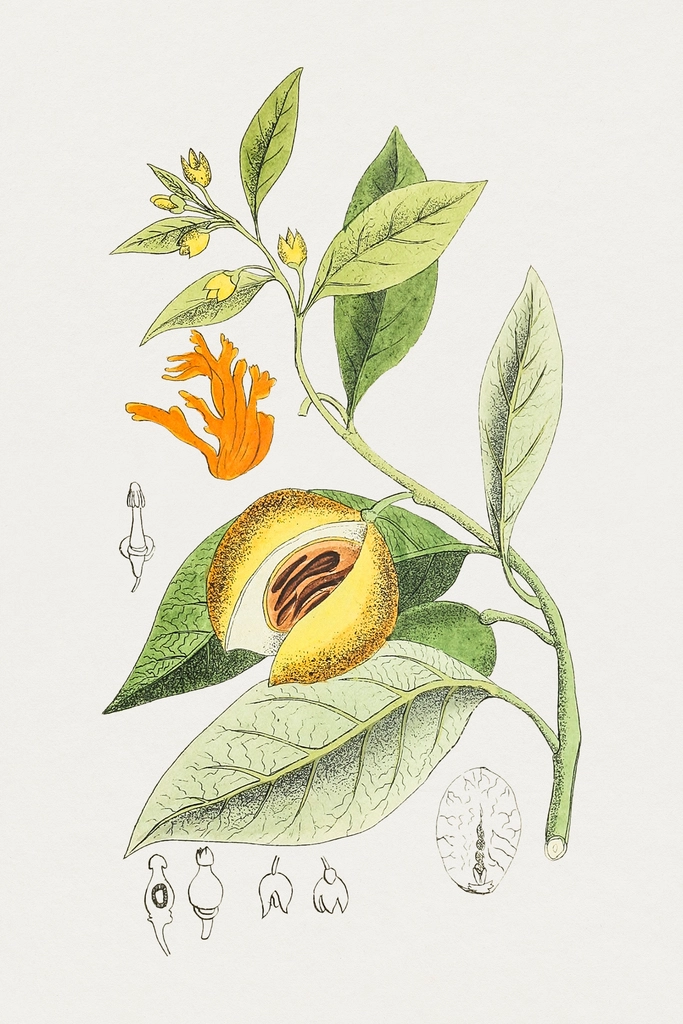
Hand drawn nutmeg tree
by
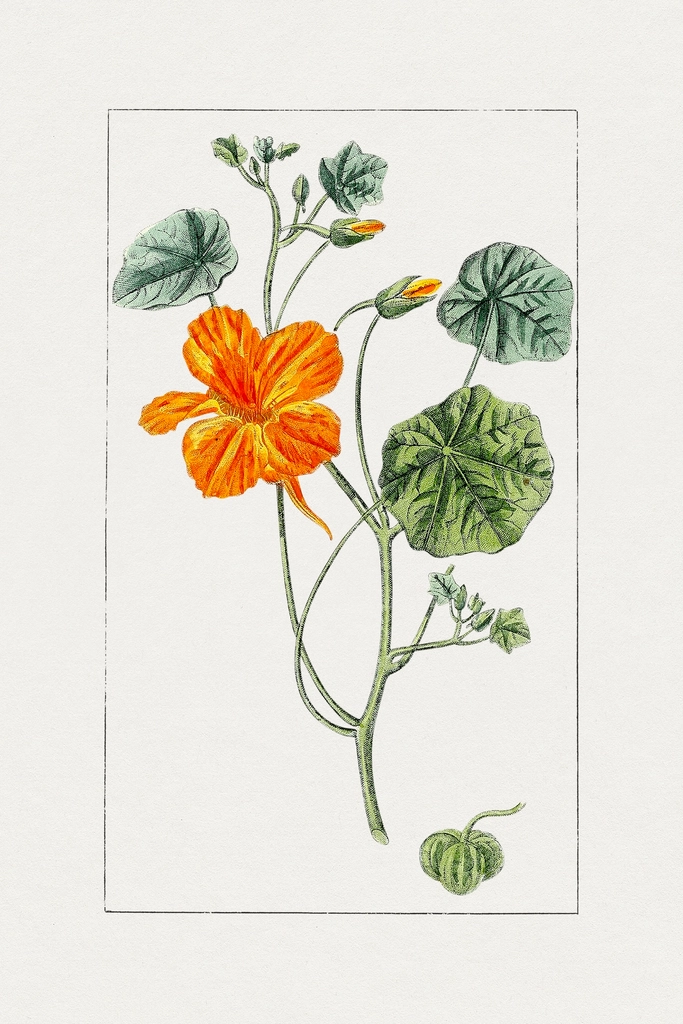
Hand drawn garden nasturtium
by
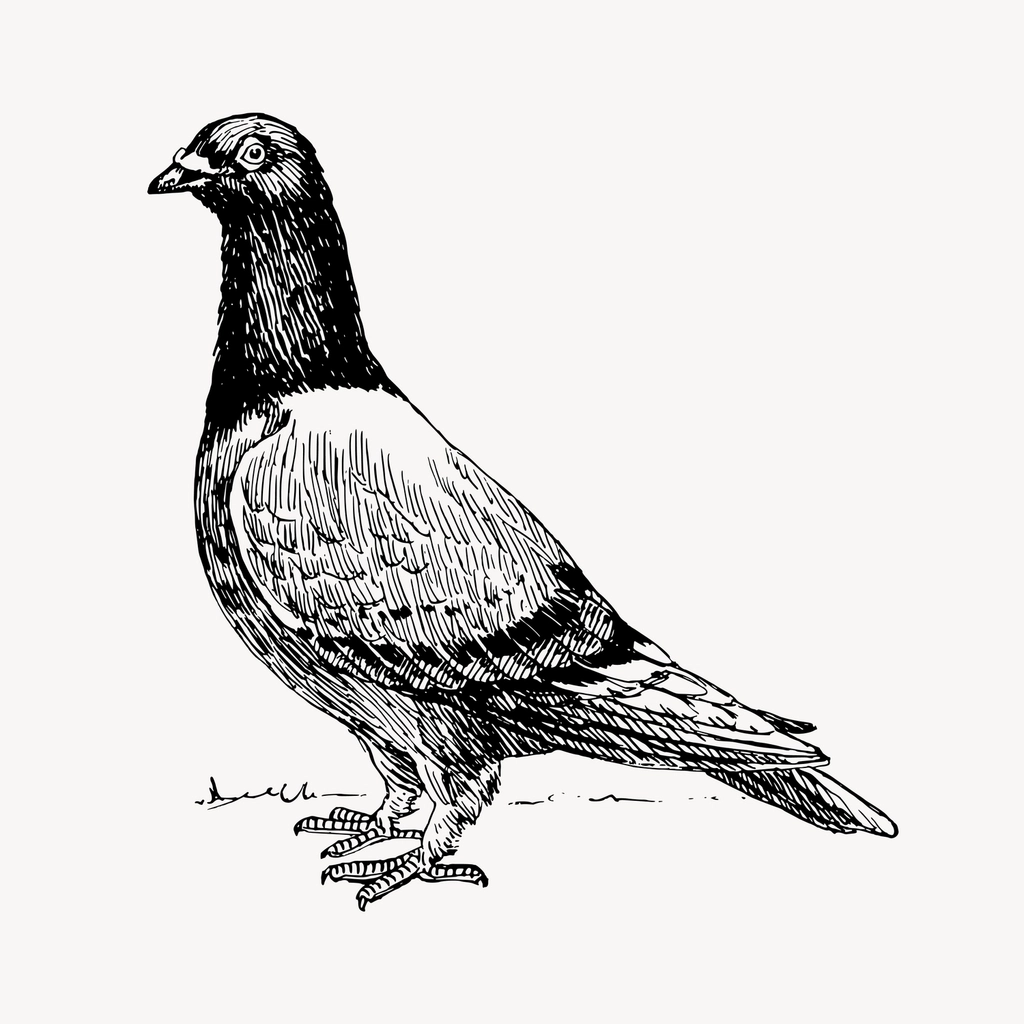
Pigeon bird drawing, hand drawn
by

Microsoft, Redmond, Washington2303
by
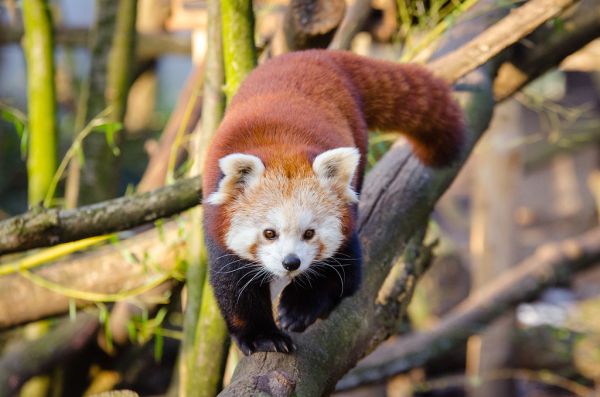
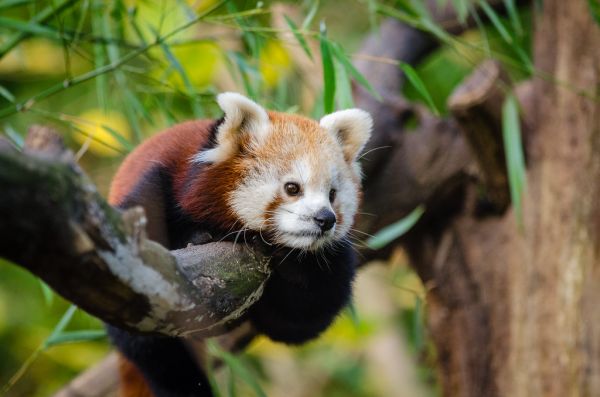
Red Panda
by

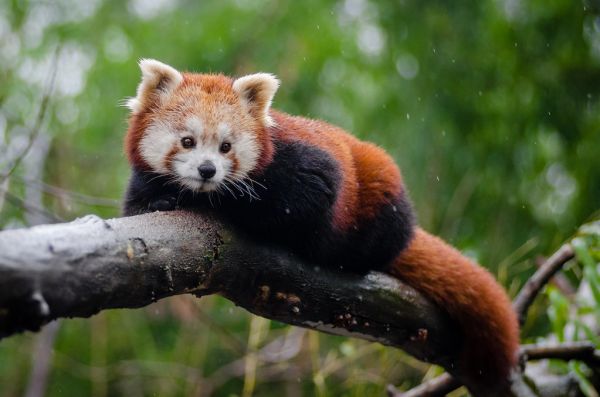
Red Panda
by

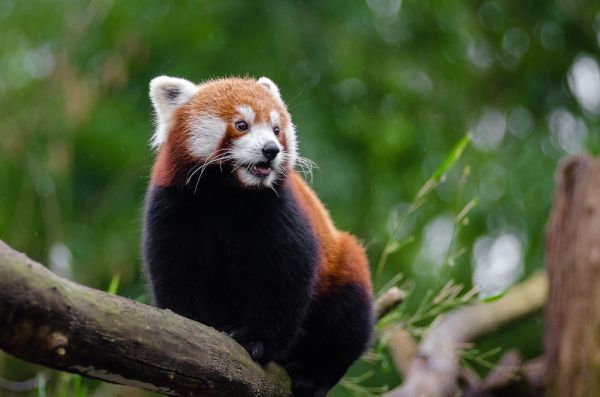
Red Panda
by

Red Panda
by
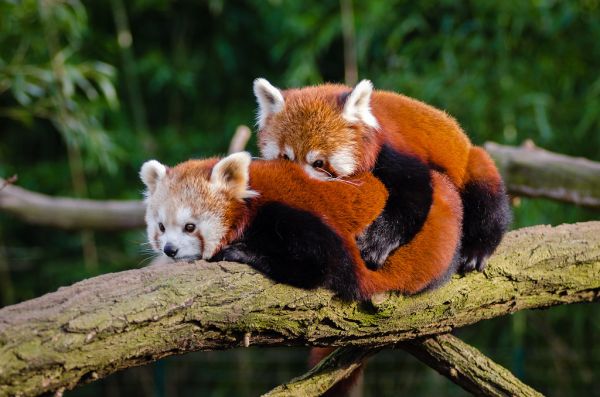
Panda Hugs!
by
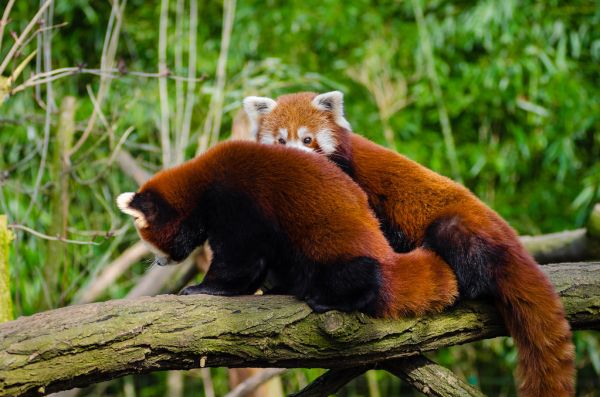
Red Panda Friends
by
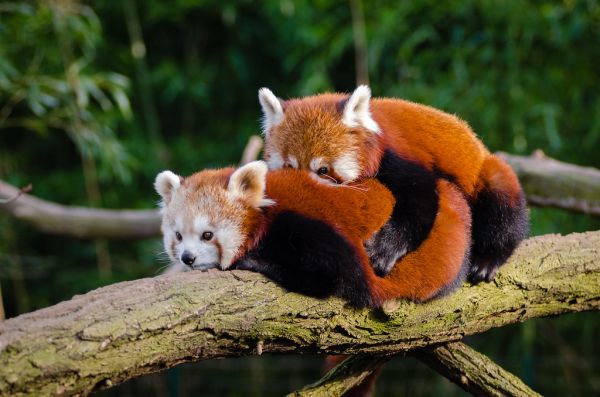
Red Pandas
by
Red Panda
by

Red Panda
by

Red Panda
by

Red Panda
by
Red Panda
by

A WOODLAND NOISE
by

Red Panda
by

Red Panda
by
Red Panda
by
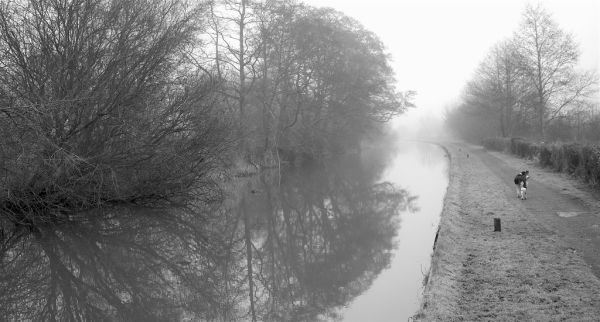
Canal Bank
by
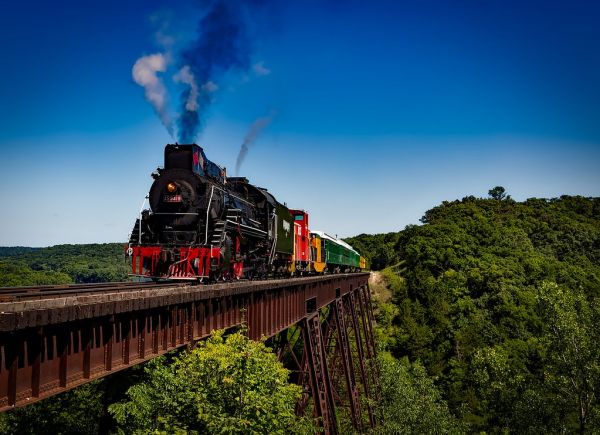
Train in forest
by
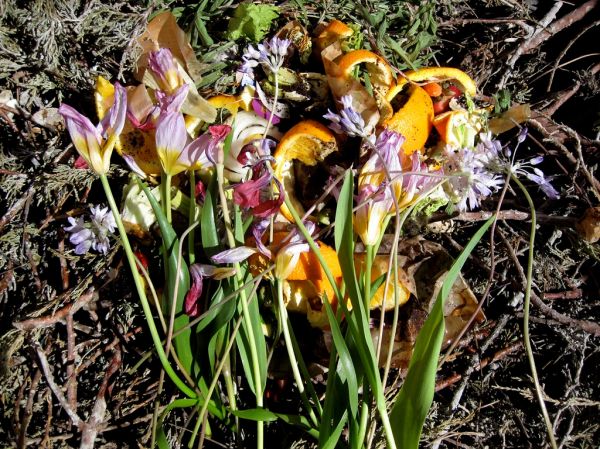
Composted
by
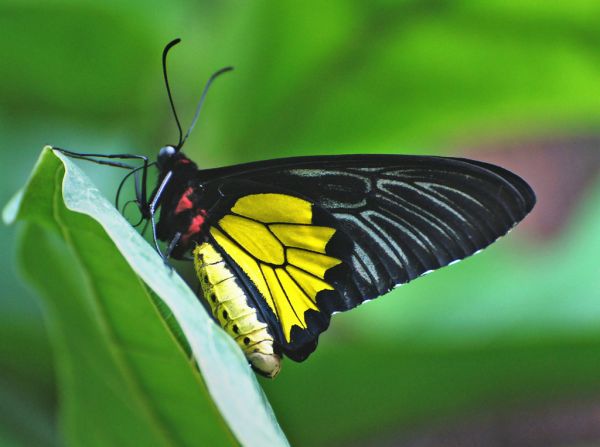
Cairns Birdwing
by

Creamsicle
by

Free texture - Summer Whispers
by
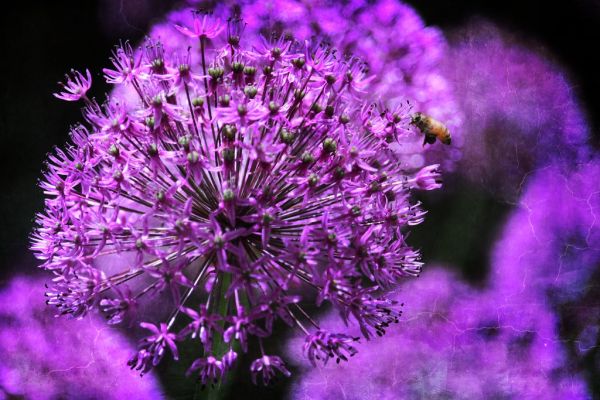
Buzz
by
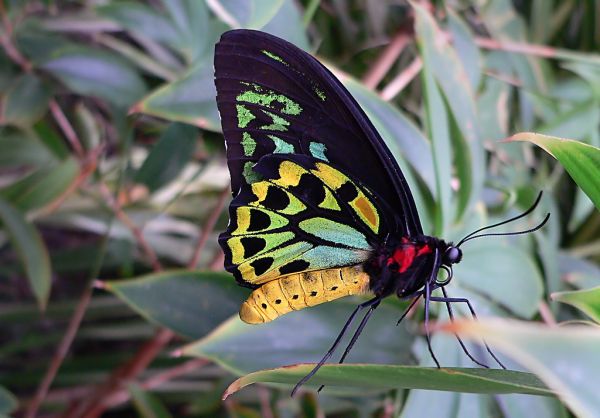
Cairns Birdwing
by
Another flower
by
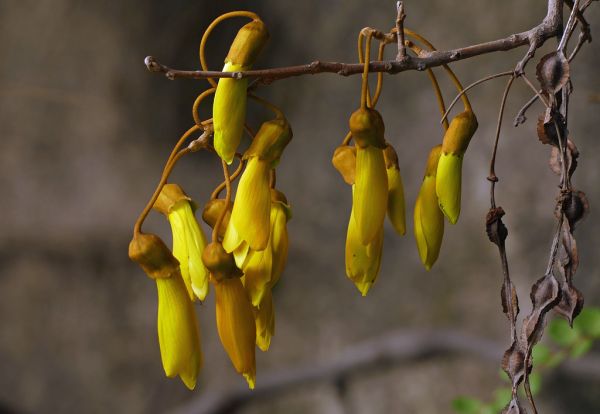
Kōwhai.(genus Sophora). NZ
by
Comments (0)
Login to comment