
Mauna Loa CO2 Monthly Mean Concentration
This figure shows the history of atmospheric carbon dioxide concentrations as directly measured at Mauna Loa, Hawaii since 1958. This curve is known as the Keeling curve, and is an essential piece of evidence of the man-made increases in greenhouse gases that are believed to be the cause of global warming. The longest such record exists at Mauna Loa, but these measurements have been independently confirmed at many other sites around the world [1]. The annual fluctuation in carbon dioxide is caused by seasonal variations in carbon dioxide uptake by land plants. Since many more forests are concentrated in the Northern Hemisphere, more carbon dioxide is removed from the atmosphere during Northern Hemisphere summer than Southern Hemisphere summer. This annual cycle is shown in the inset fi...

Related Vectors

Red Panda
by

Red Panda
by

Red Panda
by
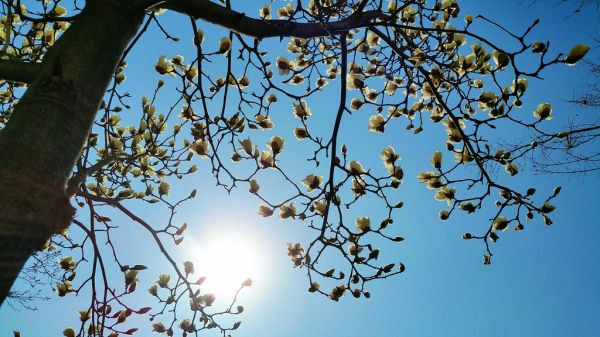
CheonIlGuk 8 ryeon Cheol ryeok 03 wol 01 il (March 24, 2020) 9:12AM magnolia flowers
by
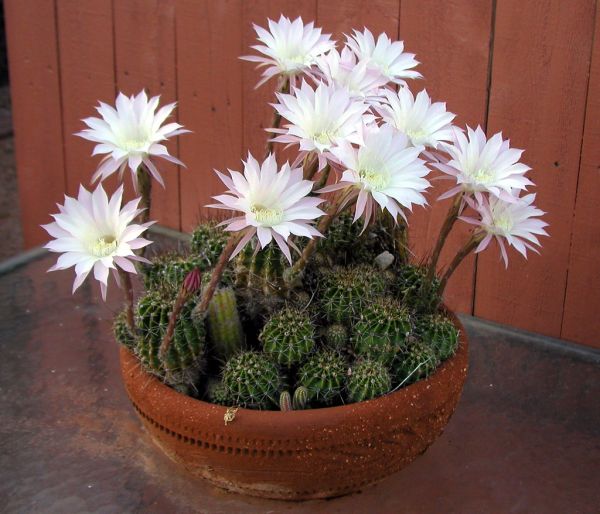
Amazing White Cactus Flowers
by
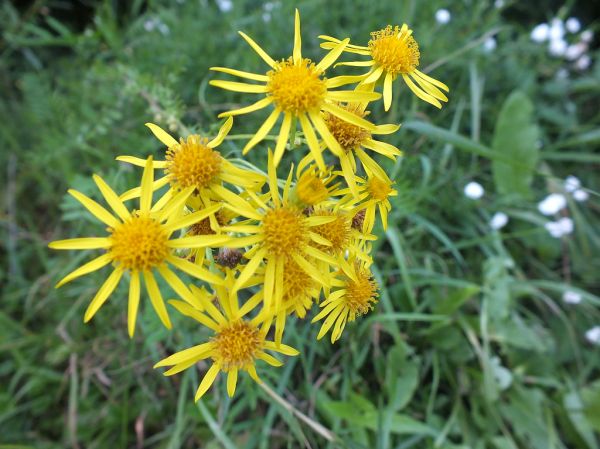
DSCF4757
by
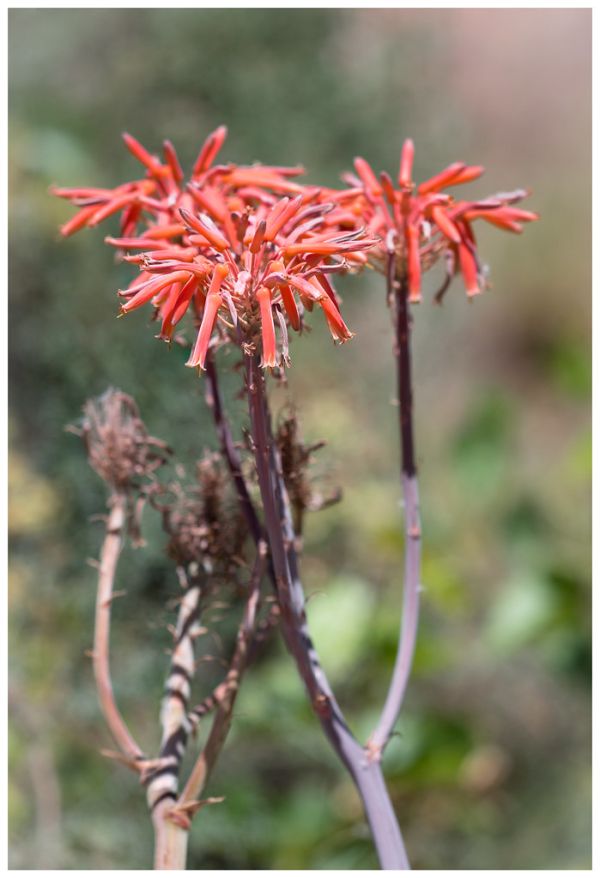
Aloe
by

Paper Kite.Malaysia.
by

Owl butterfly. (Caligo memnon)
by

Animal Cell Structure En
by

Surfer Wave
by

Hanafuda January Hikari
by

Seal Of Florida
by

Differences Between Simple Animal And Plant Cells (blank)
by

Planta De Santa María Del Naranco Vectorized
by

Weatheringcartoon
by

Coat Of Arms Of Canada Rendition
by

Reichskanzlei Fuehrerbunker
by

Carbon Sequestration 2009 10 07
by

Tchernobyl Radiation 1996 It
by

Emblem Of Mangkunagaran
by

WGSRPD Malesia
by

Simple Micropropagation Technique
by

Wappen Rosenow
by

Rosy Cross
by

Heraldisch Lippische Rose
by

Lippische Rose
by

20241206 Grid Energy Storage
by

Nitrogen Fixation Fabaceae En
by

Conceptual Diagram Example
by

Mycorrhizal Network
by

Bandeira Do Distrito Federal (Brasil) (1891–1960)
by

Leaf Tissue Structure Zh
by

Potetometer
by

Chloroplast Diagram Sr
by

Chlamydomonas Reinhardtii Vector Scheme
by
Comments (0)
Login to comment