
20211109 Frequency Of Extreme Weather For Different Degrees Of Global Warming Bar Chart IPCC AR6 WG1 SPM Tl
Bar chart showing frequency of extreme weather for different degrees of global warming, based on data from IPCC AR6 WG1 SPM (Summary for Policy Makers). This SVG file contains embedded text that can be translated into your language, using any capable SVG editor, text editor or the SVG Translate tool. For more information see: About translating SVG files. Suggested caption: : The IPCC Sixth Assessment Report (2021) projected multiplicative increases in the frequency of extreme events compared to the pre-industrial era for heat waves, droughts and heavy precipitation events, for various global warming scenarios. Based on data from Fig. SPM.6 of: Climate Change 2021 / The Physical Science Basis / Working Group I contribution to the WGI Sixth Assessment Report of the Intergovernmental Pan...

Related Vectors

Red Panda
by

Red Panda
by

Red Panda
by
CheonIlGuk 8 ryeon Cheol ryeok 03 wol 01 il (March 24, 2020) 9:12AM magnolia flowers
by
Amazing White Cactus Flowers
by
DSCF4757
by
Aloe
by
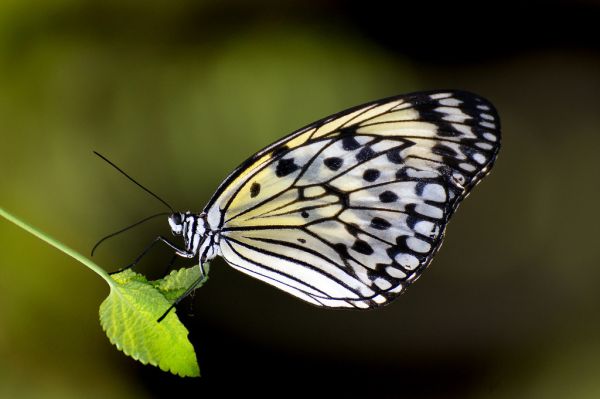
Paper Kite.Malaysia.
by
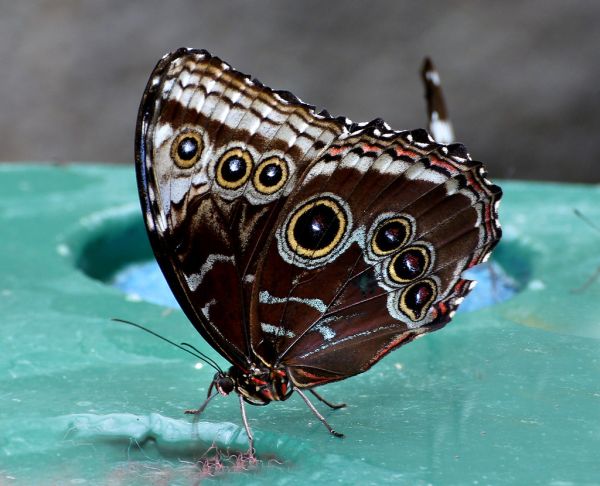
Owl butterfly. (Caligo memnon)
by

Animal Cell Structure En
by

Surfer Wave
by

Hanafuda January Hikari
by

Seal Of Florida
by

Differences Between Simple Animal And Plant Cells (blank)
by

Planta De Santa María Del Naranco Vectorized
by

Weatheringcartoon
by

Coat Of Arms Of Canada Rendition
by

Reichskanzlei Fuehrerbunker
by

Mauna Loa CO2 Monthly Mean Concentration
by

Carbon Sequestration 2009 10 07
by

Tchernobyl Radiation 1996 It
by

Emblem Of Mangkunagaran
by

WGSRPD Malesia
by

Simple Micropropagation Technique
by

Wappen Rosenow
by

Rosy Cross
by

Heraldisch Lippische Rose
by

Lippische Rose
by

20241206 Grid Energy Storage
by

Nitrogen Fixation Fabaceae En
by

Conceptual Diagram Example
by

Mycorrhizal Network
by

Bandeira Do Distrito Federal (Brasil) (1891–1960)
by

Leaf Tissue Structure Zh
by

Potetometer
by

Chloroplast Diagram Sr
by
Comments (0)
Login to comment